Ask the Experts Part II: Declining Rig Counts and High Storage Levels
4 min readIn our monthly Energy Market Intel Webinar series, we offer our customers the opportunity to submit questions to learn more about the energy market trends that may affect their future contracting decisions. Most recently, customers requested more information about declining rig counts and their impact on prices as well as questions about regional trends during our November webinar.
Constellation’s Commodities Management Group addresses them here:
“With record injections into storage and 25% less rigs year-over-year, at what level do you think the rig count stops putting downward pressure on price? Or, around how many rigs will we start seeing prices come back up?”
The rig count is a lagging indicator, however, the natural gas-directed rig count has been falling throughout 2019 while production rose simultaneously, so it seems somewhat counter-intuitive. Several new pipeline projects in the Marcellus and Utica shale that brought stranded natural gas supply to market in 2018 and 2019, along with a rise in “associated” natural gas (i.e., natural gas associated with the production of crude oil), were responsible for a significant increase in gas production despite the decline in drilling. Most of the rigs are in the Permian basin of west Texas where they are drilling for oil and getting the aforementioned associated gas.
There is also the issue of Drilled but Uncompleted (DUC) wells. These wells have already been drilled, so on average, 50% of the cost of developing the well has been incurred. These DUC wells may not have yet been fracked for several reasons (e.g., awaiting pipeline infrastructure, waiting for completion crews, etc.) but they, in essence, represent additional gas inventory that needs to be brought to market before additional crews may be deployed. For the rig count to rise, we need to see higher prices, and right now, with ~3.6 Tcf of gas in storage (17% higher year-over-year), we need to work through our storage surplus and some DUC inventory before additional rigs are deployed.
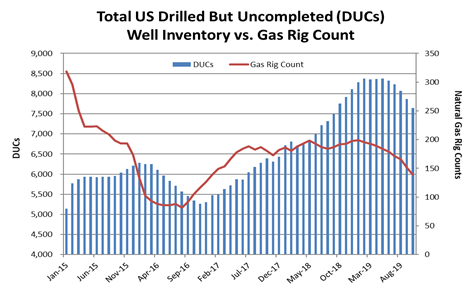
Source: EIA & Baker Hughes
Finally, natural gas prices are overall inversely related to the level of underground storage on a year-over-year basis. As of December 6th, storage stands at 3.5 Tcf vs. 2.9 Tcf for the week of December 6, 2018. This represents a 593 Bcf or 20% surplus and a mere 14 Bcf deficit to the five-year average. If we do not experience sustained above-normal heating demand this winter, storage could finish March 2020 at +1.8 Tcf or higher at +2.0 Tcf. This would put further downward pressure on both natural gas prices and rig counts in 2020 before we might see prices rise.
“We’ve seen SoCal basis come down ~30% from the highs earlier in the year. What is your outlook on it going forward?”
As the Energy Information Administration (EIA) has highlighted in the chart below, (see SoCal CG lower left corner), overall, we should see lower prices in 2020 based on several factors and that assumes we experience a seasonally normal winter.
Forward SoCal CG basis for January/February 2020 is about $1.65/MMBtu over the NYMEX Henry Hub forward strips. This is a positive basis but down from the winter 2019 basis of ~approximately $2.70/MMBtu. The recent return to partial service of ~175 MMcf/day on the Line 235-2 (Northern Zone) has been helpful but work on the Line 4000 remains, and there is 0.9 Bcf/day of capacity still restricted. The second difference versus last winter is that gas can be pulled from Aliso Canyon storage when demand is elevated under Level 2 Operational Flow Order (OFO) versus a provider of last resort designation, Level 5 OFO. This should help reduce spikes in spot next-day gas prices.
Colder-than-normal conditions, even for a two-week period that produces elevated demand and strong draws on storage, could result in spot market gas volatility in SoCal Citygate.
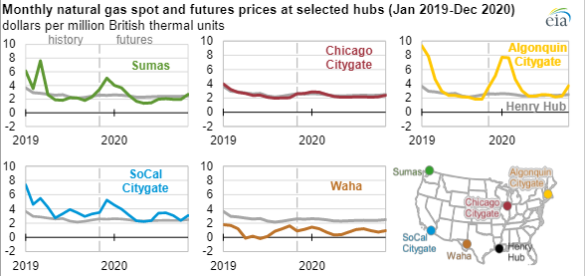
Source: EIA
See related EIA story at: https://www.eia.gov/todayinenergy/detail.php?id=42075
“The natural gas market is steeply inverted (in backwardation), and stocks are at two-year highs and 15% above prior year’s levels. If we get a warmer-than-expected winter, isn’t that a setup for a deep correction lower (bear market) in making?”
As of December 1, 2019, the natural gas market is in modest Contango with Henry Hub 2020-2024 trading at $2.27, $2.41, $2.44, $2.48, and $2.53 respectively. This noted, a warmer-than-normal winter coupled with current production of around 94 Bcf per day could place new downward pressure on prices in the first quarter of 2020. If end of March 2020 storage is above 2 Tcf, that would put downward pressure on 12-month forward gas pricing (April 2020 – March 2021) and weaken the backwardation.
Get access to more insights on the latest weather and market factors impacting your energy bill by attending our next Energy Market Intel Webinar.