Ask the Experts: Natural Gas, Shale and the Winter Season
In our monthly webinar series, the Energy Market Intel Webinar, we offered our customers the opportunity to submit questions to learn more about economic factors and marketplace trends that may affect their future energy purchasing decisions.
Most recently, customers requested information on natural gas supply and demand, shale production, the upcoming winter season, and forward pricing trends.
Constellation’s team of market experts addresses them here:
There is some discussion of natural gas storage levels and winter events such as Uri and the Polar Vortex. Do storage levels have any impact on pricing during these winter events?
On average, the U.S. will see a withdrawal of 2 Tcf over the course of winter and will generally inject that amount from April to October, barring weather-related demand. Winter demand remains the key variable as cold or milder weather can swing the end of March/October levels. For example, at the end of March 2014, storage stood at 824 Bcf or -863 Bcf (-51%) below March 2013 levels. Now, by October 2014, storage had refilled to 3,571 Bcf, a total 2.75 Tcf of injections.
From the chart below, you can see the market’s reaction to the January and February 2014 polar vortex event, which propelled production higher over the course of the year as producers were able to bring more wells online. What is different in 2021 is that producers are being required to show more capital discipline post-COVID.
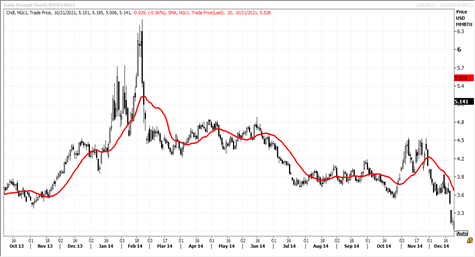
Source: NYMEX
Has Texas taken initiative, particularly regarding cold weather preparations? What is the risk that we have a repeat of last year?
The Public Utility Commission of Texas (PUCT) has directed ERCOT to take measures for winter preparation. This involves inspections by ERCOT of up to 200 generating units that experienced troubles in February and the winter storm preparations that they have undertaken. Distribution utilities have worked with gas companies to identify critical infrastructure that would be kept on in winter events, therefore helping to maintain supply of gas to plants.
Finally, the PUCT is considering several proposals to revise the Operational Reserve Demand Curve (ORDC) from $9,000/MWh down to either $5,000/MWh or $4,500/MWh by January 1st. The lower price cap would be offset by an increase in ORDC charges when reserve levels are higher, 3,000 MW up to ~6,000 MW. This would send incentives to generators to come online sooner than usual in a pending crisis mode of growing scarcity. They will likely be voting on this measure within the next 30 days so ERCOT can implement changes. See the chart below where there would be a loss of revenue in the blue shaded areas, but an increase in the green shaded areas.
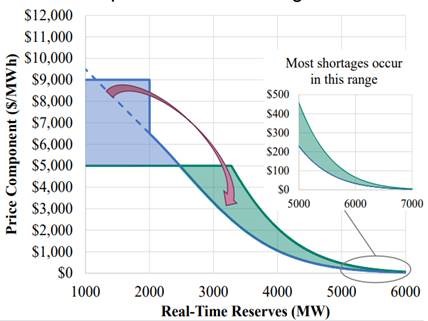
Source: Potomac Economics
Where is all the natural gas production going to come from to supply LNG projections?
Based on 3rd party projections, we will see growth come from Gulf Coast shale basins. The Permian basin will grow from 14% of U.S. supply in 2021 to 20% by 2024 and this will likely require higher oil prices as most gas in the Permian is “accociated” gas. The Appalachian basin will stay net flat at ~24% of natural supply, while Eagle Ford and Haynesville will grow 1% each respectively.
The ~20% reduction in shale production is over what period? Annually?
Yes, there is approximately a 19% to 25% decline in Appalachian shale well production that varies by geography and play. There is, nationally, a 17% decline from mid-2021 to mid-2022 that requires 19.6 Bcf/day of new production to come online to offset natural decline rates in shale wells. The annual decline is less so in outer years, but shale output continues to decline without further investment. Therefore, shale producers will need to be putting more of their free cash flow into new wells to maintain current production levels and that will likely require a higher natural gas price closer to the 10-year average of ~$3.50/MMBtu or higher.
Would it not be prudent to have 2023 energy purchasing plans in place and be taking a position(s) in 2024 and possibly 2025 over the next 3 to 6 months?
We are experiencing “backwardation” of the current market, i.e. current prices are higher in the nearer years and 2022 than 2023 and 2024. Most of the movement in the market has started in May and has been moving through December 2022 in the gas and power markets. Taking a 24–36-month view to layer in incremental purchases could give customers to-dollar cost average in outer years. Take ISONE and ERCOT as examples.
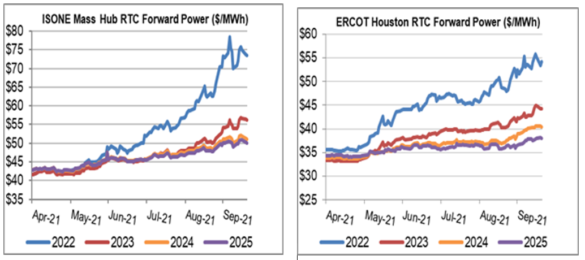
Source: Constellation
If we have a colder-than-normal winter, than 2023 prices could move higher due to lower-end winter storage levels in March 2022. Since we do not know how winter will play out, it is important to have price points to buy if the market drops but have price points to “stop” out and make additional purchases if the market starts to rise.
Get access to more insights on the latest weather and market factors impacting your energy bill by attending our next Energy Market Intel Webinar.