Ask the Experts: Low Gas Prices & Limited Pipeline Capacity are Leading to a Rise in Drilled but Uncompleted Wells, Primarily in Texas
3 min readIn our monthly Energy Market Intel Webinar series, we offer our customers the opportunity to submit questions to learn more about the energy market trends that may affect their future contracting decisions, such as weather, gas storage and production, and domestic and global economic conditions. Most recently, customers asked questions during our May webinar that Constellation’s Meteorology team and Constellation’s Commodities Management Group addressed:
A report from the Energy Information Administration (EIA) talked about “wells drilled but not completed.” Would that have any impact on the wells increasing or decreasing?
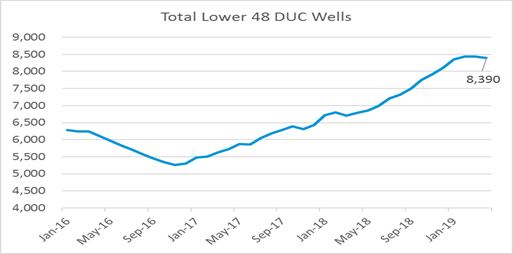
Each month, the EIA reports the number of Drilled but Uncompleted (DUC) wells by major basin with a month-over-month change and historical data. DUC wells are wells that could be awaiting completion crews, new pipeline takeaway capacity, higher market prices or, in a small percentage of cases, could be wells that are non-producing or “dry”.
DUC wells bottomed at 5,266 in November 2016 and have been climbing steadily to 8,390, driven primarily by growth in the Permian Basin (Texas and New Mexico), which has the most wells of any shale basin.
The rising count of DUC wells represent natural gas inventory that is waiting to be brought online and so a rising DUC that is then completed due to new pipeline capacity or rising prices would bring more supply online over time.

Source: Energy Information Administration
Why isn’t natural gas hitched to crude oil today like it was back in 2005 through 2008?
Natural gas and crude oil were both rising in price consistently from 2005 through 2008 along with nearly every other commodity in the world. Natural gas and crude oil were generally rising in tandem in a global commodity trend. With the financial collapse of 2008 and with the advent of the Shale Revolution, natural gas uncoupled from crude oil. Crude oil is a global commodity subject to geopolitical and global economic forces and, up until now (this is now changing with the advent of liquefied natural gas exports), natural gas pricing action was confined and defined by domestic supply and demand considerations.
Have repairs been made to Sumas natural gas pipeline, and is gas flowing from Canada to the northwestern states, business as usual?
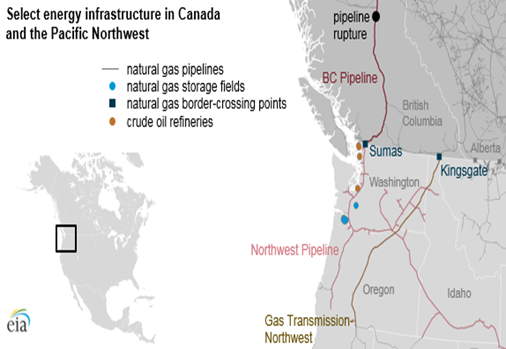
On October 9th, 2018, Enbridge’s Westcoast pipeline (Alberta, Canada) experienced a rupture that reduced flows to the Sumas import point (Washington state) to essentially zero from 1.1 Bcf/day. Volumes were restored to in December to approximately 0.8 Bcf/day for this winter, but ongoing maintenance this summer will keep volumes below full capacity.

Source: Energy Information Administration
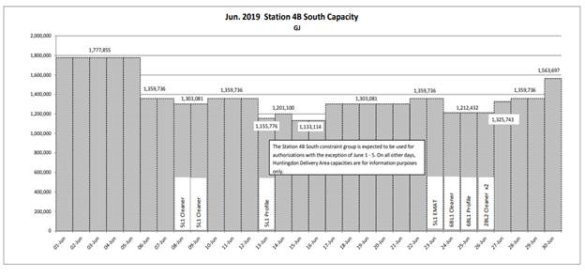
Flows on the Westcoast pipeline this winter were between 1.1-1.8 Bcf/day in the first quarter of 2018. Ongoing maintenance this summer will reduce capacity below the full 1.8 Bcf/day of capacity. The chart below depicts flows in Gigajoules (metric) and 1 Bcf = 0.95 GJ. The ongoing work will limit Canadian exports reaching their full capacity but mild weather so far this spring has led to robust injections in the Pacific states (i.e., California, Oregon and Washington) per the EIA, with storage only 12% below year-ago levels and 24% below the five-year average. These deficits have essentially been cut in half over the past month. This has limited any upside price action on regional gas prices for the short term.

Source: Enbridge Westcoast Energy
To ask our Commodities Management Group a question regarding energy market trends that may have impact on your business, email us at webinar@constellation.com.
