System Peak Loads Across the Country, Pressure on Shale Producers to Show ROI
3 min readDuring the July Energy Market Intel Webinar, Constellation’s team of market analysts known as the Commodities Management Group (CMG) and internal team of meteorologists presented the July and August weather forecast, an update on summer gas demand and production, and market price trends and forward price trends for 2020-2024.
Our internal meteorologist opened the webinar with a look at the July weather drivers in the context of current storage fundamentals compared to a year ago and what current trends imply for August forecasts.
Weather Update
Constellation’s Chief Meteorologist Dave Ryan touched on the Category 1 hurricane that made landfall in Louisiana on July 13, dispersed across the Midwest and then dissolved in the Mid-Atlantic states. The effects of that storm were deemed to be more bearish than bullish of natural gas and power prices as very little natural gas production was taken offline and the storm provided moisture and subsequent cooling in the interior of the country.
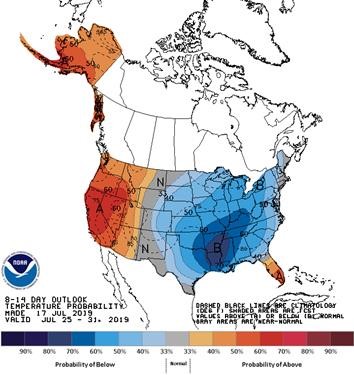
Widespread heat across the nation, including a stronger heat wave for the Midwest and East, will give way to fewer hot conditions, especially in the Midwest and around the Great Lakes area during the last week of July.

Source: NOAA
The pattern is changing a bit as we head toward August. A wet ground in the Midwest and East should favor high humidity. A weak El Niño should continue to favor tropical activity in the Gulf and near the East Coast. Overall numbers should be close to normal. Will we see summer fade from here?
Natural Gas & Power Supply & Demand
The CMG reviewed various natural gas and electric power-related supply and demand fundamentals to assess the current state of energy pricing action and where things may be heading in the near and mid-term. Natural gas inventories in storage continue to grow at a rate that the market perceives as bearish of pricing, and the Energy Information Administration (EIA) has estimated end-of season inventories at just slightly above the five-year average.
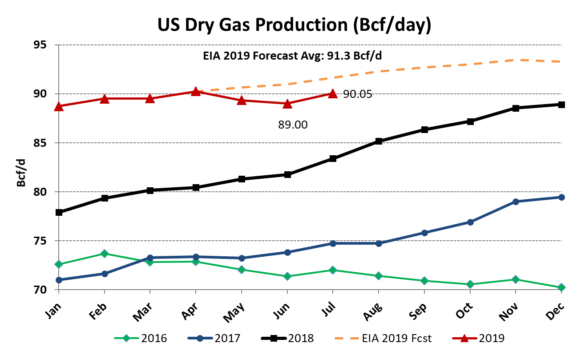
Natural gas production year-to-date has largely stalled at 89.5 billion cubic feet (Bcf) per day, and this has captured the attention of some energy market watchers. The team looked at what appears to be a growing call from investors to natural gas producers to show greater financial returns in lieu of increasing output. Return on equity among shale producers has been “subpar” with only ten percent of natural gas producers in a recent survey having free cash flow, and several Wall Street sources have noted that capital in the oil and gas industry is tightening. Will these developments have an impact on natural gas and power pricing in the second half of the year and potentially beyond? That is certainly a consideration going forward.

Source: EIA
Lastly, they reviewed current and future natural gas and electric power pricing in the context of the primary supply and demand drivers. To find out these details, listen to the webinar recording or download the PowerPoint presentation by visiting our Resources page.
To stay updated on these topics and more, join us in September for our next Energy Market Intel Webinar on September 18, 2019, at 2:00 p.m. ET. In next month’s webinar, we will examine preliminary winter weather drivers and the impact of El Niño on winter weather. We will continue to monitor growth in gas production as well as demand drivers for natural gas and power markets.
