
A Texas Summer Outlook: High Temperatures and the Impact of Wind
3 min readSummer is off to a strong start in Texas.
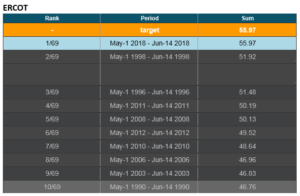
ERCOT’s cooling load season surpassed previously-strong years of 1998 and 2011. The difference between those years and 2018 is that the heat came later in summer (July-August) when average daytime temperatures were higher and wind output was lower.
Average temperature departures in June month-to-date have been higher by approximately 4 degrees Fahrenheit (“F”) in Dallas and 2-3 degrees F in Houston. Temperatures have averaged in the upper 90s F for Dallas and mid-90s for Houston. In addition, we have seen 55 Cooling Degree Days (“CDD”) through June 14, well above 1998 and 2011.
While those are warm temperatures for June, they are not the strong 100+ F temperatures that pushed ERCOT load to new record loads of 71,000+ GW, last set in August 2016.
As the chart below illustrates, Dallas may see 18 days above 100F, but most of that comes in July/August. A good reference point for Texas peak cooling load demand is when temperatures in Dallas and Houston are a combined 205+ F, with Houston over 100 F.
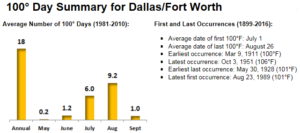
Source: Radiant Solutions
Temperature Departures From Normal
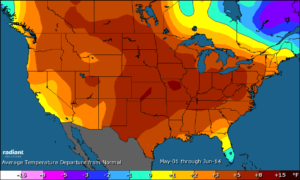
Source: Radiant Solutions
Source: Radiant Solutions/NOAA
The Impact of Wind
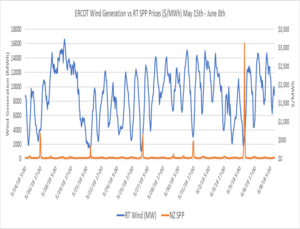
We did see the impact that low wind can have on real time volatility on June 5th when real time prices spiked to $3,100/MWh for part of 3-4:00 pm CST. This was a reminder that wind is an intermittent resource which could lead to tighter reserve margins in high-demand late-afternoon periods in Texas, and customers should be aware of the risk of market volatility.
Wind generation has been strong in June, but customers should be aware that it could fade later this summer in July/August. As the map below illustrates, strong wind in west Texas—coming in at 105%-115% above normal—was helping to offset higher loads. An important note of comparison regarding wind is how it can fade in the later part of July/August. For example, in looking at Midland, Texas last summer the wind averaged 12.3 mph from May 1st to July 15th but averaged only 9.24 mph from July 16th – August 31st, a reduction of approximately 25%. With ERCOT having 20 GW of installed wind capacity, a reduction in wind speed can have an impact on available reserve margins.
Wind Speed Departures From Normal
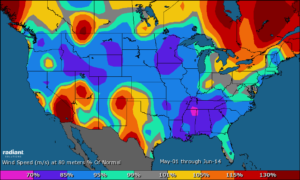
Source: Radiant Solutions
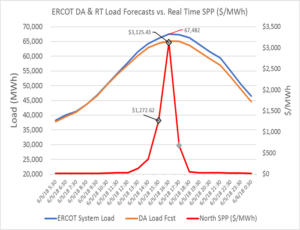
The chart below is a graphic representing wind output in GW vs. Real Time Settlement Point (SPP) prices for ERCOT North Zone. On June 5th wind output dipped below 2 GW between Hour Ending 15:00 – 17:00 (3pm -5 pm) CST. ERCOT real time system load came in about 2.5 GW higher than the Day Ahead Forecast (65 GW vs 67.5 GW).
Source: ERCOT
Source: ERCOT
Source: ERCOT
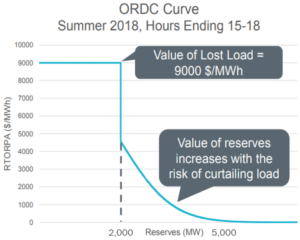
This tightened reserve margins on a 30-minute available basis to below 3,000 MW, triggering Operational Reserve Demand Curve (ORDC) charges to reflect the value of scarcity pricing. As reserves get tighter from 3,000 MW down to 2,000 MW, the ORDC adder exponentially increases until at 2,000 MW it is equal to $4,500/MWh, and below 2,000 MW goes immediately to $9,000/MW or $9.00/KWh.