Ask the Experts: The Current State of Gas Storage, COVID-19’s Impact on Energy Demand
3 min readIn our monthly Energy Market Intel Webinar series, we offer our customers the opportunity to submit questions to learn more about the energy market trends that may affect their future contracting decisions. Most recently, customers requested more information about natural gas storage reaching its peak, break-even prices for gas producers and COVID-19’s impact on energy demand in our March webinar:
Constellation’s Commodities Management Group and Exelon’s chief economist Ed Fortunato address them here:
Is it possible in this year for the first time ever we will be 100% at full capacity across the U.S. natural gas storage facilities?
It’ll be more like the need is touching “Full” rather than having moved past it. Physical limits on the gas system prevents each storage facility from reaching 100%, but the way it looks now we will be close. We are currently sitting at 80% above year-ago levels so we will start the April-October injection season off at a very high level. It was higher in 2016 at approximately 2.4 Tcf, but we were not facing a severe economic slowdown in second quarter 2016.
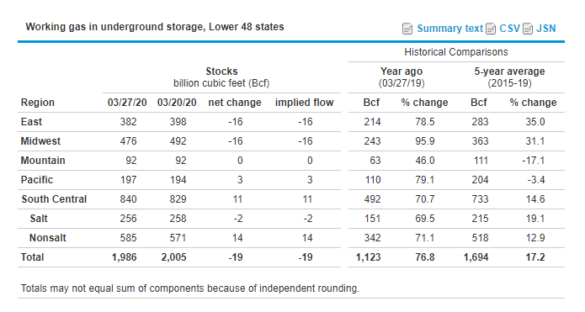
Source: EIA
Considering this is a public health emergency that effectively requires an economic slowdown (both supply and demand) due to the social need to distance/isolate, what are your thoughts around where the bottom of this could be, and what initial steps will be needed to restart/rebound?
It all depends on the path of the virus. Unemployment numbers for Q2 could be as high as 20%. If the virus wanes quickly and government stimulus provides a shot of adrenaline, then Q3 could be much improved. If current conditions linger through the summer, we may further negative impact.
What is the break-even prices for producers for gas per MMBTU?
It varies by well. Some type 1 wells are as low as $2, and less premium wells are closer to $4 with some wells with negative costs given oil production with the gas.
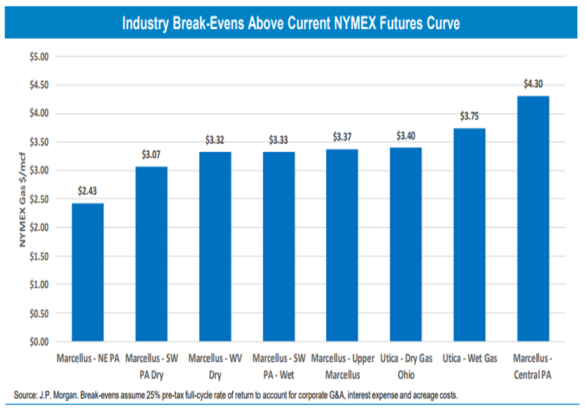
Source: Range Resources
With everyone working at home now, away from their commercial, industrial office environments, how do you think the grid’s (e.g., PJM) daily load forecast changes and how does it maybe shift the system’s annual peak(s) (e.g. 5 highest load days for coincident peak). How do you forecast and plan for that now?
With only about a week and half of data in the big shutdown (as of March 25th), we’re still learning how demand is changing. Daily load shapes are taking on the characteristics of a weekend or holiday shape rather than the traditional weekday load shape. Assuming society begins to return to normal by the end of Q2, it’s a safe bet the high 5 highest load days will occur during the summer months but they will be set at lower overall demand levels.
Register for our webinar on April 22nd at 2 p.m. ET, where you hear attendees discuss current economic conditions in light of the impact of COVID-19 and get access to a summer 2020 weather preview.