Ask the Experts: Gas Exports & Impact on Gas Prices, Average Break-Even Prices
3 min readIn our Ask the Experts blog series, we offer our customers the opportunity to submit questions to learn more about the energy market trends that may affect their future contracting decisions, such as weather, gas storage and production, and domestic and global economic conditions. Most recently, customers asked questions that Constellation’s Commodities Management Group answered:
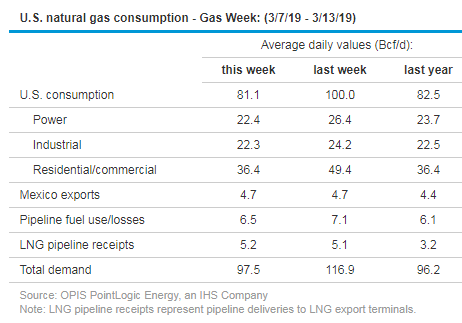
Do we have to be concerned about the amount of potential exports of gas — both pipeline and liquefied natural gas — if we get into the position where export volumes of gas outstrip production and continental USA gas requirements, thus driving natural gas prices up? When will the markets reflect this potential shortfall?
Current liquefied natural gas (LNG) exports are averaging ~5.1 Bcf/day as both Train #5 at Sabine Pass and Corpus Christi train #1 have come online and as they are their commissioning runs. Exports will likely get to 8 Bcf/day by the end of 2019. By the end of 2020, LNG exports should reach 9.5-10 Bcf/day and pipeline exports to Mexico will increase from ~4.5 Bcf/day currently to ~7 Bcf/day by the end of 2020.
Source: EIA
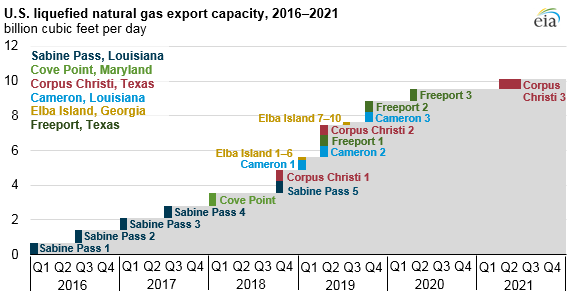
Source: EIA
Offsetting this will be projected growth in production. In 2019, if production were to grow by ~4 Bcf/day from 85-90 Bcf/day, that would offset a large portion of growth in LNG exports. The key factor will be weather and how strong summer cooling load could be over the summer months, primarily July and August.
If export demand outpaces growth in production in 2019 and 2020, then that would likely lead to tighter storage (barring a bearish winter or summer) that reduces residential or commercial (R&C) demand.
What’s an average break-even price point for gas producers?
The average break-even price for shale gas producers varies by region and the percentage of natural gas liquids (NGLs) present in a well. These NGLs are indexed to the price of oil and therefore lowers the cost of wells. Break-even prices need to ultimately consider not just the costs of drilling and fracking a well but also the land acquisition and corporate overhead costs.
The chart below illustrates the range of break-even prices by shale basin among multiple producers. This range is a combination of geology; not all wells have the same characteristics in how much gas can be recovered, and producers have different economies of scale. Most regions have a break-even price above $2.50-$3.0/MMBtu, but the Marcellus Northeast has the lowest overall costs. This is a result of a higher concentration of NGLs present in those wells. Current NYMEX forward prices for 2020-2023 are at ~$2.75/MMBtu so nearing the lower range of break-even costs for most plays. If producers begin to scale back production and if the growth in production were to slow along with a potential widening of the storage deficit on a year-over-year basis, forward prices for balance of 2019 and Q1 2020 could see upside pressure.
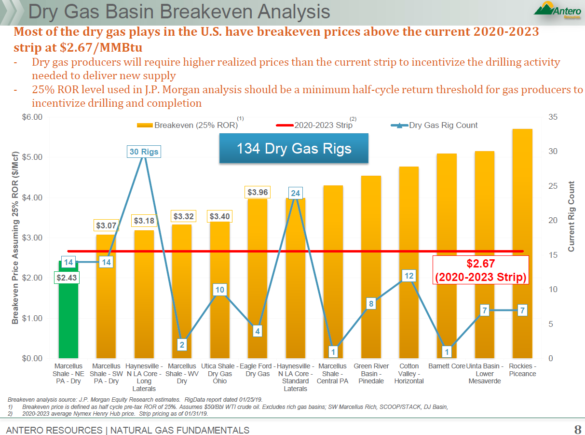
Source: Antero Resources
To ask our Commodities Management Group a question regarding energy market trends that may have impact on your business, email us at webinar@constellation.com.