
The January Freeze and its Impact on Your Energy Bill
7 min readFollowing two of the warmest winters on record in 2016 and 2017, the United States has endured a record-setting stretch of cold to start 2018. The sustained blast of Arctic air that has blanketed the nation from Christmas through the first week of January resulted in record breaking natural gas demand, frozen gas production wells, and a significant uptick in energy price volatility. This shot of Arctic air also provides a timely reminder that energy budgets are not immune to market volatility, even in a low natural gas price environment.
How has the Cold Impacted Energy Market Fundamentals?
Residential and commercial heating is the largest component of natural gas consumption during the winter months. At the height of the cold snap, more than 70 billion cubic feet of natural gas per day (Bcf/d) was consumed for heating needs. This accounts for over half of total U.S. gas demand. Power grids, which are increasingly relying on natural gas-fired generation, also faced some of the highest winter demand levels on record. This set off competition in some regions between heating load and generators for natural gas supply on constrained pipeline systems. In addition, natural gas export activity remained at record highs during recent weeks, adding more than 2 Bcf/d of incremental demand to the market compared to last winter. According to the EIA, estimated total U.S. natural gas demand reached an all-time high of 150.7 Bcf/d on January 1, 2018, far surpassing the previous record of 143.3 Bcf/d set during the Polar Vortex on January 7, 2014.
Exacerbating the problem was the fact that sustained cold temperatures also resulted in curtailments on the supply side of the market. In times of very cold temperatures, moisture or other liquids in natural gas can freeze, blocking the flow of gas at the wellhead. Due to these “freeze-off” events in producing regions such as Texas, the Rockies, and the Northeast, U.S. natural gas production in early January declined by as much as 5 Bcf/d, or 6% lower than its record-setting December average of more than 76 Bcf/d.
Elevated gas demand and reduced supply has resulted in increased reliance on natural gas storage inventories in the short-term. During the week ended December 29th, the EIA reported a withdrawal of -206 Bcf, which is more than double the average demand on storage over the past five years. Forecasts for the storage report during the week of Jan 5th suggest the EIA could announce a withdrawal that exceeds the all-time weekly record of -288 Bcf. As a result, storage inventories have fallen to a 6% deficit versus year-ago levels and the five-year average, and the gap could widen in coming weeks.
How Have Prices Responded?
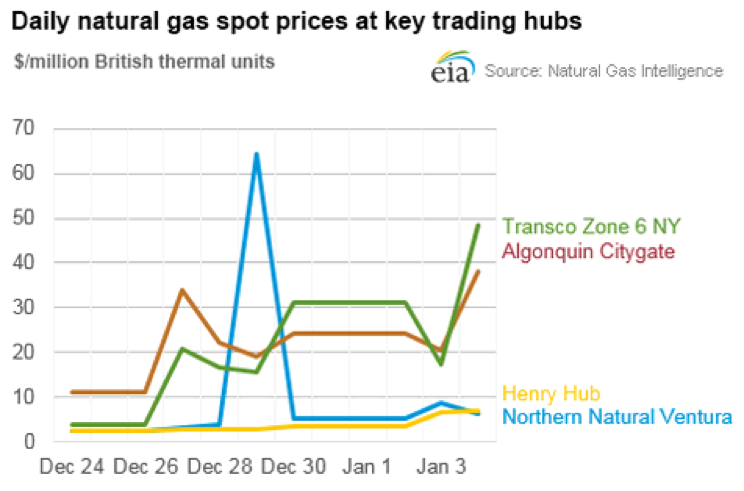
The cold weather has driven natural gas cash prices and index power prices to multi-year highs in many parts of the country. Benchmark U.S. natural gas spot prices at Henry Hub in Louisiana jumped to a peak of nearly $7/MMBtu, the highest level since the height of the infamous 2014 Polar Vortex. In the pipeline constrained New York and New England markets, natural gas prices for next-day delivery climbed into the triple-digits. Even the Midwest and Midcon markets were not immune to a significant increase in gas price volatility. Prices at Chicago Citygate reached $9/MMBtu to mark the highest spot gas price since the cold February of 2015. At the Northern Natural Ventura hub in Iowa, a critical day notice and supply interruptions sent physical gas prices up to $65/MMBtu, the highest settlement in years.
The volatility in physical gas prices demonstrates that basis cost blowouts over the course of 10, 20 or 30 days during the winter can be far more impactful to a natural gas buyer’s budget than a 50 or 75 cent move in the NYMEX price.
Source: EIA
With near-record power demand, soaring natural gas prices, and the need to rely on alternative fuels such as oil in some markets, hourly electricity prices across the country also rose the highest levels in several years. Daily average day-ahead index power prices in the PJM, ISO-NE, and NYISO markets have averaged over $100/MWh since the start of the January. By comparison, index prices in those markets outside of New England averaged under $40/MWh until the last week of December.
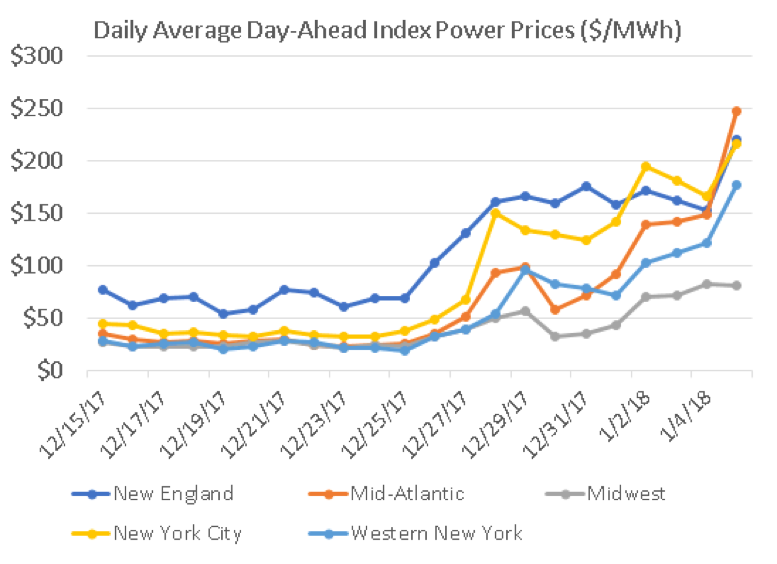
Source: Constellation, from PJM, ISO-NE, NYISO data
Why Haven’t NYMEX Prices Shown a Bigger Response?
While the cold weather sent spot gas and power prices soaring, the deep freeze has had a muted impact on NYMEX natural gas futures and forward power prices. Although frigid forecasts did result in a 50 cent rally in NYMEX prompt month prices to a high of $3.10 on Jan 2nd, prices retraced to a low of $2.75 by Jan 5th – a far cry from last winter’s high of $3.99/MMBtu during a period of relatively mild weather.
Fundamentally, market participants are likely focused on year-on-year production increases (+5 Bcf/d) and expectations that output will return to all-time highs (77+ Bcf/d) once the freeze-off events end. According to the EIA’s latest projections, U.S. natural gas production will average at an all-time record high of 79.7 Bcf/d in 2018, an 8.4% increase over 2017 levels. In addition, rising crude oil prices – now above $60/bbl – are boosting expectations that associated natural gas volumes will contribute to a bearish gas supply environment this year. Weather forecasts for a “January thaw” by mid-month have also contributed to price weakness in the natural gas futures market. If cold weather is not sustained throughout the winter, record production levels could swamp demand, keeping the market well supplied – and prices low – in 2018.
As the past two weeks demonstrates, simply following NYMEX prices to monitor market trends may fail to capture regional market dynamics that can significantly affect your budget. Constellation offers tools such as Market Watch, webinars, and market intelligence reports to better help your company monitor market trends.
How Does this Year Compare to the Polar Vortex?
Many energy buyers remember the painful energy price spikes encountered during the Polar Vortex in the winter of 2014. During several periods of sustained cold that winter, the maximum average daily temperature departure in the U.S. was 16 degrees F below normal. By comparison, this year’s temperature departure maxed out even colder at 18 degrees F below normal on New Year’s Day. In fact, many major population centers such as Chicago, Boston, and New York have seen sub-freezing temperatures for nearly two full weeks! Of the top-10 coldest days in the U.S. since 2000, January 1st, 2018 ranks as the coldest day on a heating degree day basis, and 4 out of the 10 coldest days nationally have occurred in the last two weeks.
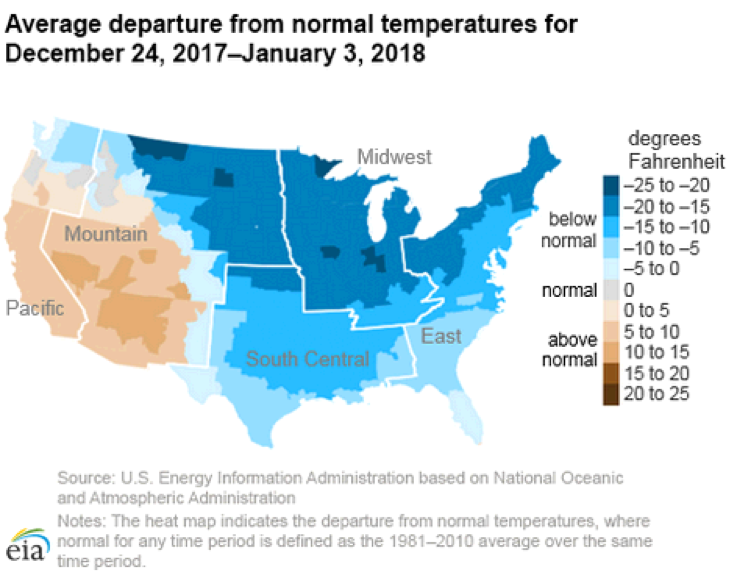
Source: EIA
Although the energy price spikes in the index power markets are higher than we’ve seen in two years, they pale in comparison to those at the height of the Polar Vortex, likely due in part to measures taken by grid operators to avoid a repeat of that type of extreme volatility. For example, following the Polar Vortex, FERC required increased coordination between pipelines and generators, while ISOs instituted measures to increase grid reliability such as the Winter Reliability Program (ISO-NE) and Capacity Performance (PJM).
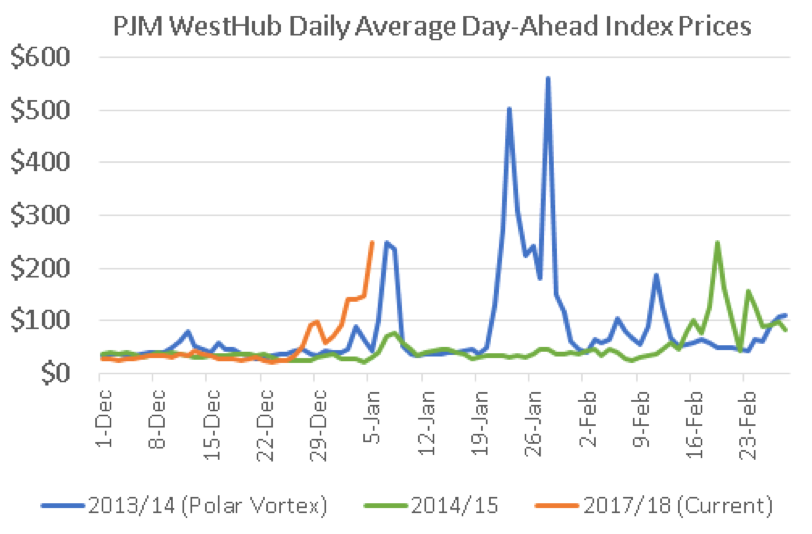
Source: Constellation, from PJM data
How Will this Impact my Energy Budget?
Customers who have fixed 100% of their energy supply price with Constellation will not face an increase in their unit rate ($/kWh or $/Dkth). However, customers who used a higher than normal amount of electricity or natural gas during the recent cold spell may notice a higher supply bill due to increased volume.
Energy buyers who have exposure to the index power or natural gas markets may be faced with bill increases next month due to higher energy prices combined with potentially greater usage. While many customers have taken advantage of extremely low index energy prices in recent years, the return of cold winter weather provides a reminder that protecting at least a portion of usage with fixed prices is a key building block of budget stability.
What Can I do to Protect my Energy Budget in the Future?
Constellation offers a suite of natural gas and power solutions that allow customers to combine the security of fixed prices with the flexibility of maintaining some exposure to the market. These programs can also allow customers to increase or decrease their index market exposure on a seasonal basis to provide more budget protection during higher volatility periods such as winter and summer. In working with our dedicated energy market professionals, customers can determine an energy management strategy that ensures the right level of budget certainty and volatility protection that works best for their unique business.
Customers can also mitigate cost increases year-round by participating in Demand Response programs, implementing energy efficiency projects, or simply by taking measures to reduce energy usage wherever possible during times of high prices. Regardless of product or supplier, all customers should carefully examine their contract language to ensure that they are not subject to unexpected pass-through costs or rate increases as a result of extreme weather events.
Don’t miss our January Market Intel webinar. Our energy market professionals will be recapping the recent cold temperatures, their effect on natural gas and power prices and how customers can further protect their energy budgets from market volatility, register today. Get additional information about how to protect your business from market volatility caused by weather, rising oil prices and more by exploring our energy management solutions at constellation.com.