
Natural Gas Exports on the Rise
4 min readThe United States has been the world’s largest natural gas producer since 2009 since the revolution of hydraulic fracking unlocked vast reserves of natural gas and oil. Earlier this year, the U.S. crossed the threshold as a net exporter of natural gas for the first time. U.S. exports offset the continued on average 5.5 Bcf/day of imports we receive from Canada. Many industry experts, as well as the U.S. Energy Information Administration (EIA), believe that the trend is likely to continue for the foreseeable future. This is primarily driven by the fact that U.S. supply has outpaced demand and exports of gas offer access to new global markets that were previously uneconomical to serve.
The shale gas revolution has ushered in a new era for the U.S. economy ─ going from energy dependent importer to energy dominant exporter. The U.S. is on the path to global swing supplier of oil and liquefied natural gas (LNG), likely by 2020. This transformation could have long-term results for the supply and demand balance of natural gas. It could also impact energy management strategies for businesses in the U.S. looking for long-term procurement solutions.
Let’s take a closer look below at the changing nature of U.S. energy infrastructure.
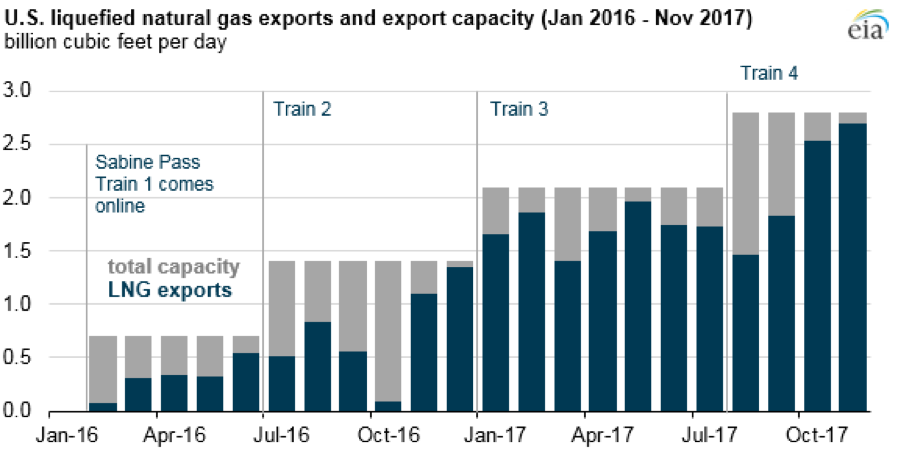
Source: EIA
Sabine Pass LNG Terminal Sets New Record for Loaded Cargoes in December
Cheniere Energy Partners Sabine Pass liquefaction facility in Louisiana has four of six LNG “trains” operational at about 3 Bcf/day of capacity. The U.S. EIA reported that Sabine Pass sent a new record of 25 cargoes from the terminal in December ─ up from the previous record of 22 in October. Train 5 is currently under construction and is expected to be operational in the second half of 2019. Meanwhile, Train 6 is still seeking a long-term offtake agreement before construction can begin. If oil prices remain above +$60/bbl, this could support LNG prices in Asia, which have historically been linked to the price of oil. This could result in additional offtake agreements for U.S. facilities.
Cove Point Facility is Operational
In December, the U.S. EIA announced that Cove Point commenced pipeline receipts of gas to begin liquification. Additionally, a cargo of LNG was imported from Nigeria ─ part of a common practice to literally cool down the tanks before taking in processed LNG at the facility. The first cargo is expected to ship in early 2018 as part of Cove Point’s commissioning phase. Cove Point has a pipeline receipt capacity of 0.7 Bcf/day. Japan’s Tokyo Gas and Kansai Electric Power are the primary long-term offtakers from the facility.
Mexico Can’t Get Enough U.S. Gas
The Sabine Pass and Cove Point facilities point to long-term energy partnerships in Asia. One of our biggest facilities trading south of the border continues to rely heavily on exports of U.S. LNG ─ Mexico is the only country in Latin America that has received imports from Sabine Pass. Mexico also relies on the U.S. for pipeline receipts of natural gas via Texas, New Mexico, Arizona and California.
According to the latest data from the EIA’s “Natural Gas Monthly” report, gas pipeline exports to Mexico reached 4.5 Bcf/day for the week ending December 27, 2017. This continues a long-term trend in which Mexico has continued to lean heavily on U.S. LNG imports for several reasons.
First, Mexico’s gas production is tied to declining oil production. Second, on the electric generation side, Mexico is retiring older, more expensive coal and oil-fired generation. Finally, higher priced legacy LNG contracts are expiring. In fact, Mexico is importing so much U.S. natural gas that when Hurricane Harvey hit the Gulf Coast earlier this year, Mexican citizens were asked to use 10 percent less gas when shipments were briefly halted due to loss of power on the U.S. side.
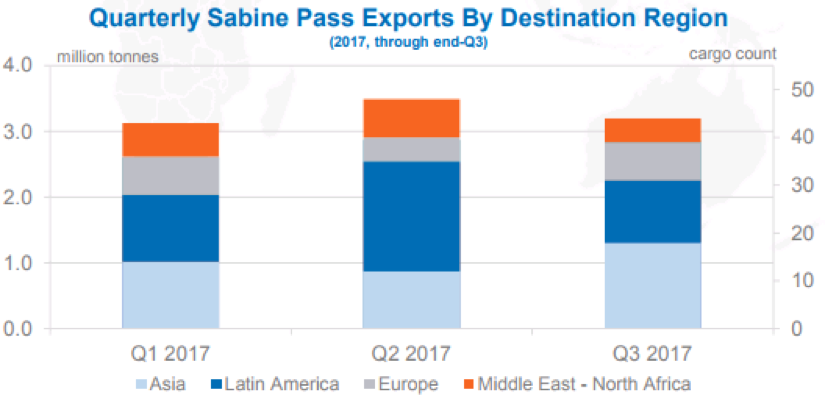
Source: Cheniere Energy
Will Exports Help Lift Domestic Energy Prices?
In 2011, as the shale gas revolution was accelerating, U.S. gas production averaged 62.72 Bcf/day for the year. It peaked in 2015 at 74.14 Bcf/day before declining in 2016 for the first time since 2007. Production has rebounded in 2017, averaging over 76 Bcf/day in December.
In 2014, oil prices were over $100/barrel, but the Organization of the Petroleum Exporting Countries (OPEC) refused to cut production when global demand slowed. By 2016, oil fell to just $26/barrel on the NYMEX. Natural gas prices hit a 17-year low in March 2016 and electricity prices saw some of the lowest prices since 2012 in many competitive markets.
LNG prices were about $18/MMBtu in November 2014 when oil was $100/bbl. Prices collapsed to $6/MMBtu by 2016 on weak Asia demand from consecutive mild winters and oil prices bottomed out in the U.S. at $26/bbl.
The current recovery in LNG prices in Asia and South America could lead to additional U.S. LNG projects beginning construction beyond the four that are currently underway and Sabine Pass and Cove Point that are already operational. Since 2016, Sabine Pass cargoes have gone to markets in Asia, Latin America, South America, Europe and the Middle East. By 2020, the 3.0 Bcf/day of exports will increase to about 8-10 Bcf/day.
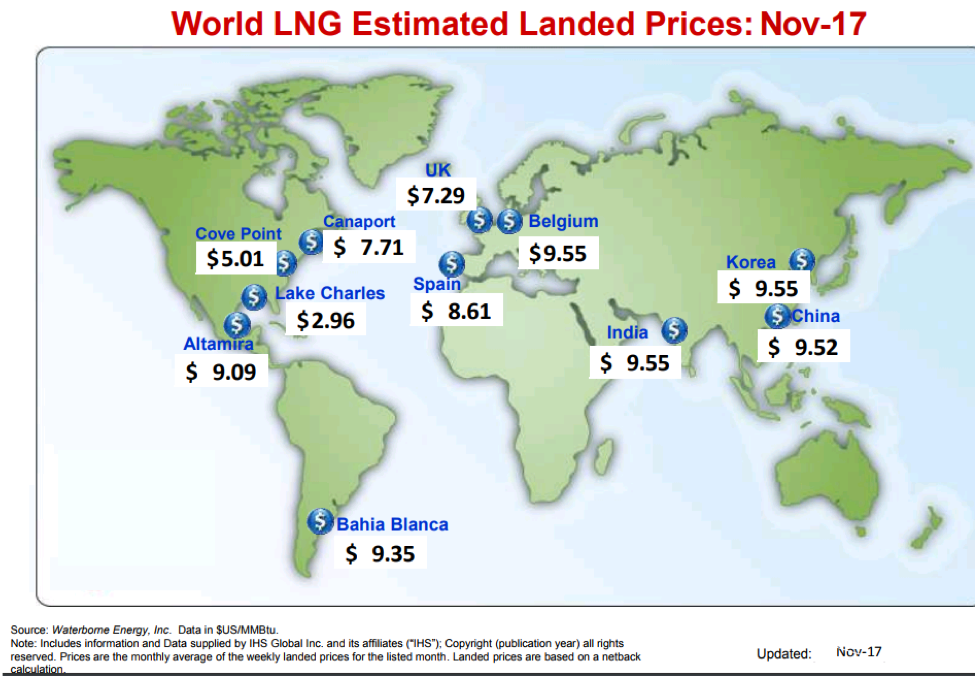
Source: FERC/Waterborne Energy
Constellation Can Help You Make Sense of Market Trends
When developing an energy strategy for your business, you should take time to understand the constantly changing market forces around you. With the U.S. exports to Mexico continuing to grow and the U.S. set to become the third largest LNG exporter worldwide (behind Australia and Qatar) by 2020, demand for U.S. gas will likely have an impact on your business. Consequently, power prices could be affected as well. How will this impact the way you think about your energy procurement decisions?
Register for our Energy Market Intel Webinar on January 24, 2018 to learn more about current market trends.