
Q&A: December Market Intel Webinar Insight
5 min readDuring Constellation’s December Market Intel Webinar, principals from our Commodities Management Group spoke to topics that could affect our customers and their businesses. This webinar provides registrants with the latest market information to help them better manage their energy strategy.
This month’s topics included an updated winter weather outlook, key winter price drivers to look out for, natural gas and power price reviews, long-term drivers for natural gas demand and more. If you were unable to attend, you can listen to the recording of the December webinar broadcast.
After the webinar, our attendees asked insightful questions that are pertinent to their unique business needs. To better provide answers and explanations to energy buyers like them, these questions and answers from our market professionals are below:
Q: Can you explain the terms “blocking” and “ridging” in a bit more detail?
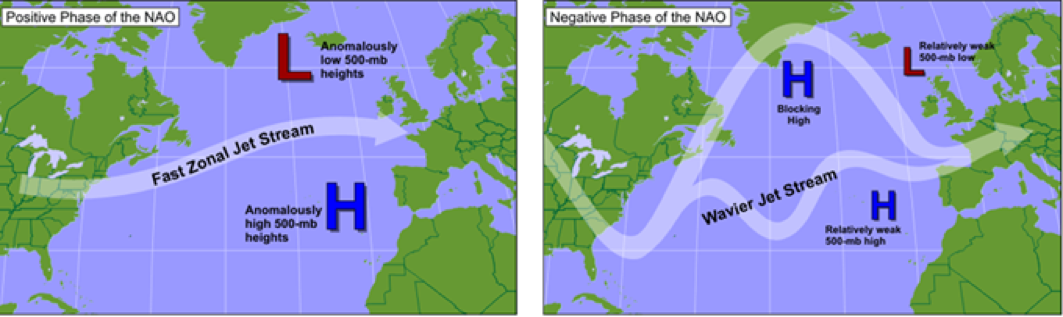
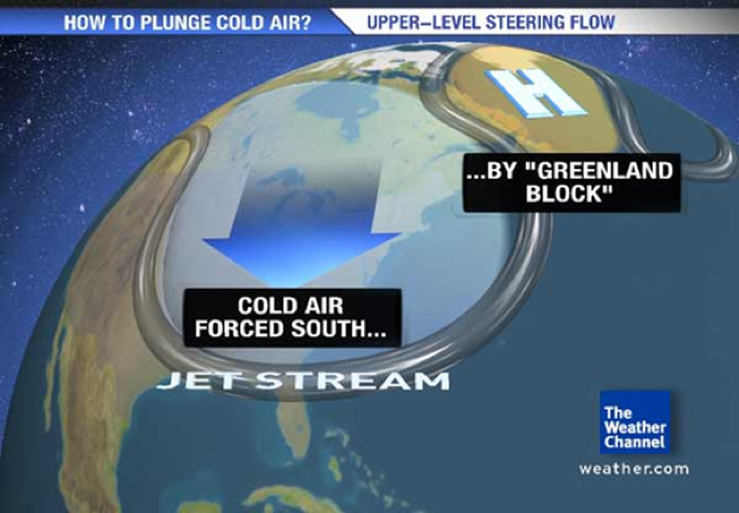
A: Blocking and ridging are terms for abnormal areas of high pressure at high latitudes. Usually, the Arctic has lower pressures and temperate regions and the tropics have higher pressures. In between these pressure differences lies the jet stream, which is a fast-moving river of air. When areas of high pressure develop over the Arctic and polar regions, the jet stream can’t move through the area of high pressure. This can be likened to a large rock in a stream, the water must flow around the rock because it can’t go through it. Since the jet stream can’t move through large areas of high pressure, it is forced to buckle and dive south. When this buckling happens, it opens the door for colder temperatures to move in.
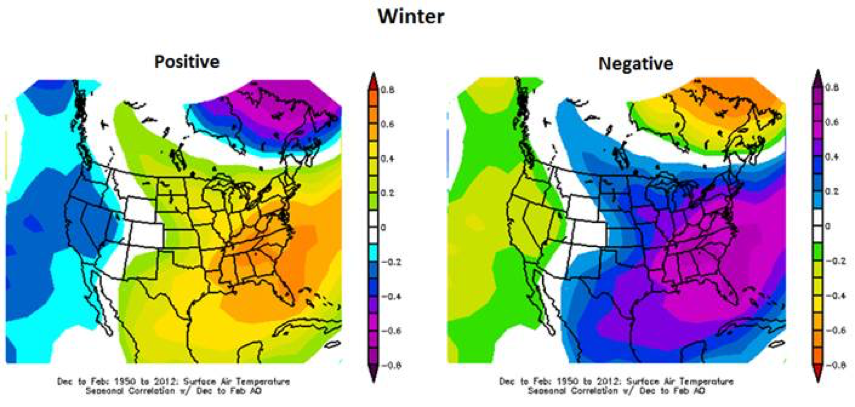
There are atmospheric indices that we look at to track blocking. The North Atlantic Oscillation (NAO) and the Arctic Oscillation (AO) are the two biggest indices that the market looks at. When the NAO is in the negative phase, this means there is blocking occurring over the north Atlantic and Greenland. When the NAO is positive, there is no blocking, allowing for a very fast jet stream. The same idea applies for the AO, negative means more blocking is occurring and positive means little to no blocking is occurring.
A few charts showing these terms can be found below:
Source: NOAA
Source: Weather Channel
Source: NOAA
Q: What was the heating degree day (HDD) rank for the month of November?
A: November 2017 ended up with 526 gas weighted heating degree days (the 14th warmest on record). This was 14 lower (warmer) than the 10-year normal and 36 lower (warmer) than the 30-year normal. November 2016 came in at 441 HDDs, which was the 2nd warmest on record.
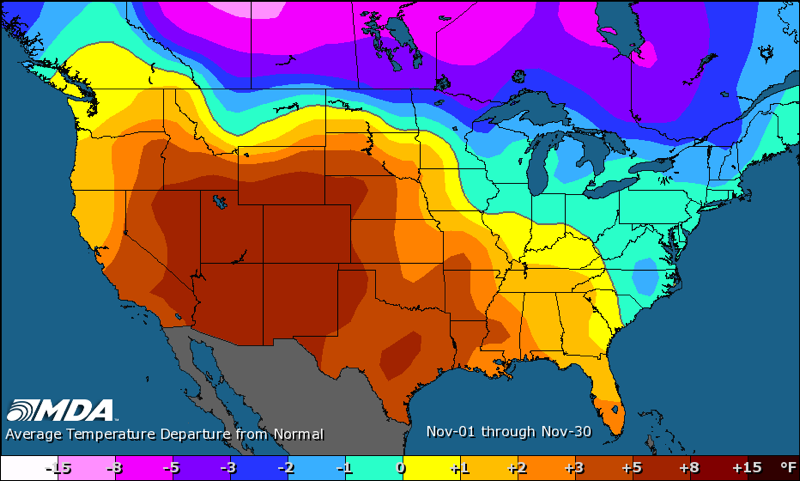
Source: MDA
Q: Can you provide an outlook or predictions for January and February weather?
A: The long term CFS (American) model shows cold along the far northern tier with mild temperatures for the southern tier. This is a classic La Nina winter pattern across North America. This could cause some drastic supply/demand imbalances when heating demand picks up during the cold winter months in northern areas like New England. Blocking is very tough to forecast beyond 10 days out. However if blocking occurs, it could result in some short-lived cold shots across the southern tier.
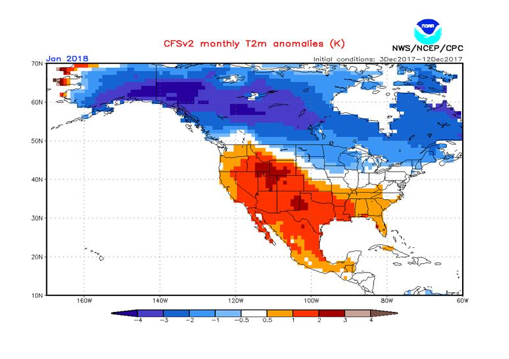
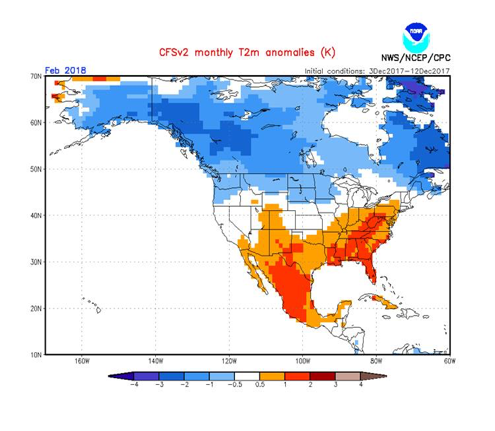
Source: NOAA
Q: Will electricity prices follow the trend in natural gas prices for the next two years?
A: As a general correlation, forward power prices reflect the direction of forward gas prices (NYMEX) because fuel costs are the largest component of overall power prices. When it comes to power prices, there is the energy component, cost of delivered natural gas to the plant and the translated power price that the energy is sold at. Gas prices do not tend to relate to the non-energy components of the all-in price of energy, such as capacity, transmission and ancillaries. While the energy component of some power prices has declined over the past several years, the prices of non-energy components have risen in some markets. Some examples or why a non-energy costs may rise is ongoing transmission projects and new gas fired generation being built when older coal plants retire.
Q: If the oil industry has not had positive cash flow for 3 years, how can they stay in business?
A: Oil producers have a long history of taking profits and putting them back into new wells, some are profitable and some are not. A recent Wall Street Journal (WSJ) article highlighted how some producers have had positive cash flow from traditional oil sources (pockets of oil and gas), but have had negative cash flow from shale sources. Shale production through it’s hydraulic fracturing process is an intense capital undertaking. Due to this intense capital need, external capital and debt has been required to fund the growth of shale fracking because it could not be funded fully by operational cashflows. There has been significant improvement in days to completion and length of laterals, which has improved cash flows since 2012, but hydraulic shale fracking is still below traditional oil (see chart below).
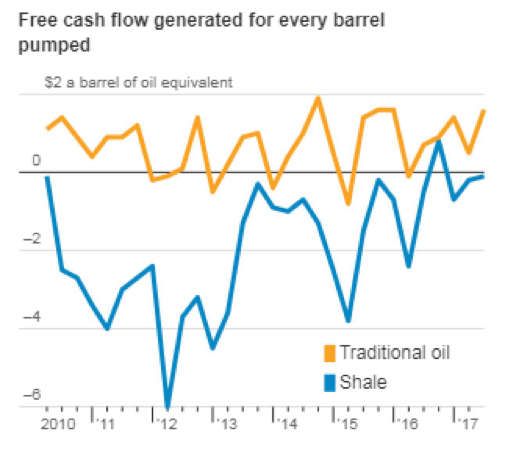
Source: WSJ
Another reason for oil remaining profitable are the significant differences within the industry. The “big oil” companies (Exxon, Shell, etc.) have large international projects that can swing cash flow views. As mentioned earlier, some oil wells are more productive than others with some producing nothing at all. Oil prices in 2014 collapsed from $100/bbl to $26/bbl in 2015, which resulted in a wave of industry bankruptcies and consolidation. This caused producers to focus on their most productive and profitable plays while selling others to raise cash. This also caused large institutional investors to generally push companies to fund the drilling programs with operating cashflows. Still, one third of rigs in the U.S. are operated by private companies (mostly private equity) that may or may not impose financial discipline.
New money will continue to try opportunities that offer above average rates of return. On December 14, 2017, a large private equity firm, Warburg Pincus, announced it would invest $780 million dollars with a Texas shale startup. The startup, ATX Energy Partners, currently has no assets. The management at ATX Energy had previously worked with Warburg, where it invested $650 million in the Permian basin only to sell that stake to Diamondback Energy in March for $2.55 billion dollars. Investors will continue to seek above average operators who are better at managing cash flow and have properties that are likely to rise in value as oil prices rise.
While the questions and answers featured help explain current market issues, they do not encompass the whole presentation. You can attend our January Market Intel Webinar for more market insight from our energy professionals, register today. Get additional information about how to protect your business from market volatility caused by weather, rising oil prices and more by exploring our energy management solutions at constellation.com.