
Shale Gas and Growth in Renewables Continues to Pressure Power Prices
5 min readLarge base load generators across the country are under continuing pressure in a low power price environment. Two market forces that have accelerated over the past few years to put pressure on power prices are the shale revolution and the growth of renewable generation. The shale revolution has significantly reduced the cost of natural gas, while economies of scale and efficiency gains have reduced overall costs of solar and wind generation. In 2016, natural gas surpassed coal as the leading source for electricity generation and has remained just under coal generation in 2017. The continued economic challenges that legacy coal and nuclear units face with a changing landscape could see generation reserve margins reduced. This could lead to price volatility if a weather driven event (winter/summer) impacts the market with a surge in demand.
The Impact of Price Trends
A recent Wall Street Journal (WSJ) article highlighted the ongoing pressure that power prices are under, focusing primarily on Texas. Vistra Energy recently announced the retirement of three older coal units with a combined generation capacity of ~4,300 MW. These plants could not compete with ERCOT’s real time index prices that averaged ~$25/MWh in 2016 compared to $55/MWh in 2007, the two primary drivers being cheaper natural gas and expanded renewable capacity.
ERCOT, the grid operator in Texas, is not alone in this trend. In the Northeast, the PJM independent market monitor stated index prices averaged $29/MWh in 2016, the lowest level since 1999 (which is when the competitive market opened in PJM). By comparison, PJM prices averaged $68.50/MWh in 2008.
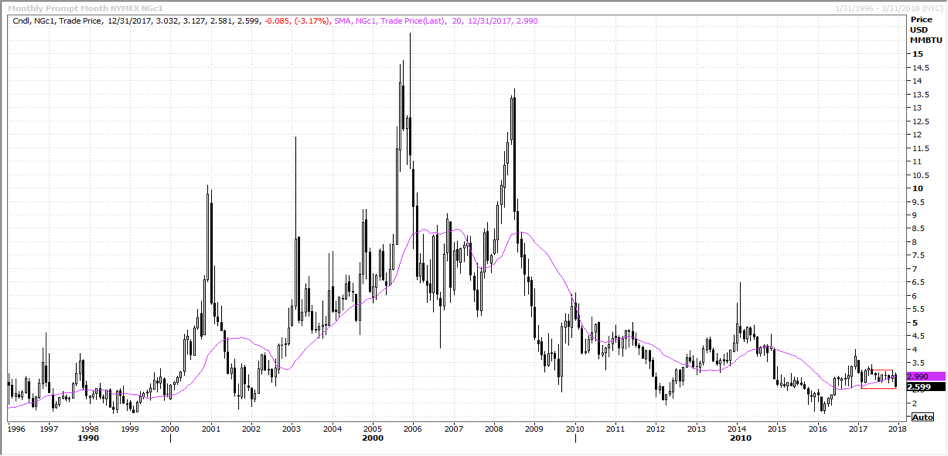
Fuel costs are a significant component in the price of power and natural gas generation units are typically the “marginal” dispatch units during the daytime “on peak” hours. Therefore, the price of natural gas largely sets the energy cost of the price of power. The chart below shows how NYMEX natural gas prices hit a 17 year low of $1.68/MMBtu in March 2016 (as compared to $13.60/MMBtu in 2008) and brought power prices back to their lowest level since 1999 in PJM.
Large base load generators across the country are under continuing pressure in a low power price environment. Two market forces that have accelerated over the past few years to put pressure on power prices are the shale revolution and the growth of renewable generation. The shale revolution has significantly reduced the cost of natural gas, while economies of scale and efficiency gains have reduced overall costs of solar and wind generation. In 2016, natural gas surpassed coal as the leading source for electricity generation and has remained just under coal generation in 2017. The continued economic challenges that legacy coal and nuclear units face with a changing landscape could see generation reserve margins reduced. This could lead to price volatility if a weather driven event (winter/summer) impacts the market with a surge in demand.
The Impact of Price Trends
A recent Wall Street Journal (WSJ) article highlighted the ongoing pressure that power prices are under, focusing primarily on Texas. Vistra Energy recently announced the retirement of three older coal units with a combined generation capacity of ~4,300 MW. These plants could not compete with ERCOT’s real time index prices that averaged ~$25/MWh in 2016 compared to $55/MWh in 2007, the two primary drivers being cheaper natural gas and expanded renewable capacity.
ERCOT, the grid operator in Texas, is not alone in this trend. In the Northeast, the PJM independent market monitor stated index prices averaged $29/MWh in 2016, the lowest level since 1999 (which is when the competitive market opened in PJM). By comparison, PJM prices averaged $68.50/MWh in 2008.
Fuel costs are a significant component in the price of power and natural gas generation units are typically the “marginal” dispatch units during the daytime “on peak” hours. Therefore, the price of natural gas largely sets the energy cost of the price of power. The chart below shows how NYMEX natural gas prices hit a 17 year low of $1.68/MMBtu in March 2016 (as compared to $13.60/MMBtu in 2008) and brought power prices back to their lowest level since 1999 in PJM.
Production Impacting Prices
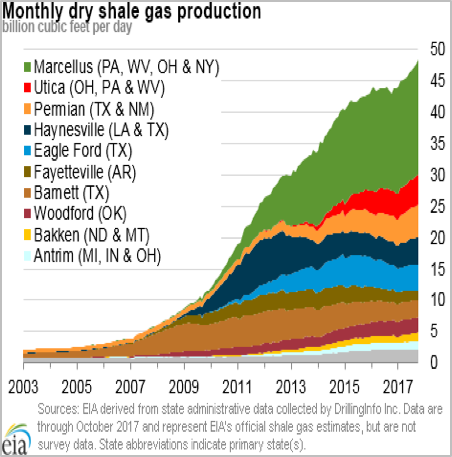
What drove natural gas and power prices higher from 2000-2008 was declining gas production from conventional sources (55– 50 Bcf/d) and rising power generation demand. This build out of gas fired generation capacity increased the annual share of power generated from natural gas from approximately 15% to 33% by 2016. Meanwhile, shale production in the Barnett shale of Ft. Worth/Dallas, Texas in began in 2006-2007, but accelerated after 2009.
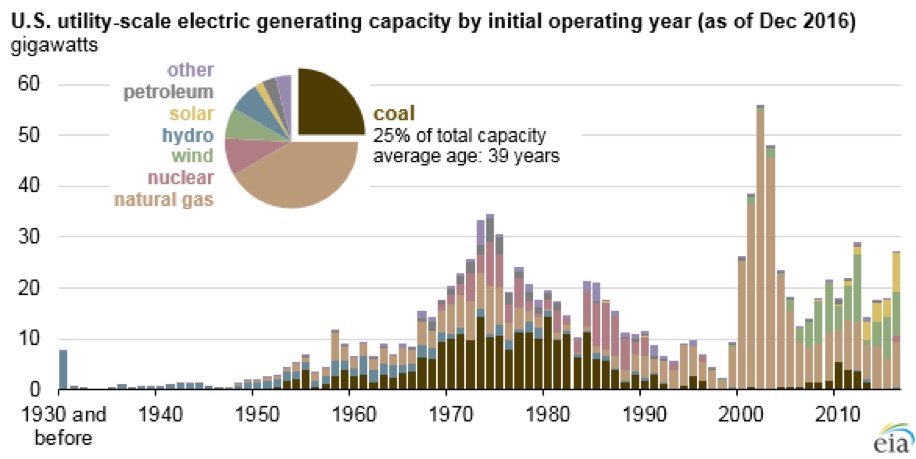
As the chart from EIA illustrates below, at the time that gas fired generation builds were slowing down around 2008, renewable generation of wind and solar capacity was increasing. This year, Texas will see 20,000 MW of installed wind capacity, the most of any state in the U.S. In 2016, wind provided 15% of the all the power generation in Texas, surpassing nuclear output which was at 12%.
The mixture of declining gas costs, improved efficiencies in gas fired generation, growing renewable capacity with expanding government incentives, better manufacturing designs and energy efficiency programs have all contributed to older coal and nuclear plants having to compete for flat or declining load. The build out of wind generation has reduced prices in overnight “off-peak” periods when wind is strongest, while solar capacity has, in California for example, reduced load during afternoon periods before an evening spike as sunset approaches.
Volatility Still Remains
The move towards renewable generation does not immediately take into account the intermittent nature of those generation sources. Most renewable generation needs to be backed by gas and coal generation to balance its output. This places further reliance on gas fired generation and in winter months when demand for gas is highest, gas pipeline capacity can be tight. This could lead to periods of volatility, like what occurred in January and February 2014 during the Polar Vortex events.
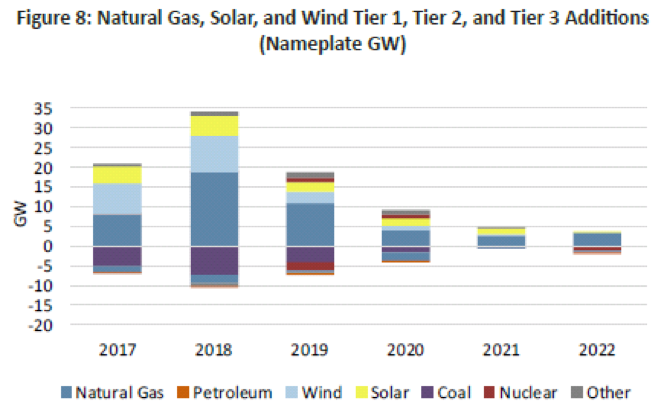
A second driver of volatility could be declining reserve margins. The North American Reliability Corporation (NERC) released its 2017 Long Term Reliability Assessment (LTRA) and it highlighted the challenges baseload coal and nuclear are facing. Both Texas and the Southeast are already seeing tighter generation reserve margins because of coal retirements and nuclear plants cancellations respectively . With conventional generation retirements outpacing conventional plant additions and new builds being intermittent wind and solar capacity, there is a growing reliance on gas fired generation demand.
Gas prices are currently below $3/MMBtu and production has recovered to new all-time highs, above 76 Bcf/day. However, supply could still tighten as we saw in late 2016 after prices reached 17-year lows that spring. Investors have begun to put pressure on gas and oil producers to begin/increase dividend payments or share buyback purchases instead of drilling more wells. In addition, LNG export demand will increase in 2018 as another 2.5 Bcf/day of new capacity comes online.
The market could tighten once again in 2018 if oversupply pushes oil and gas prices even lower. To protect against market volatility, customers can work with their Constellation Business Development representative to create a comprehensive energy management strategy. Solutions like SmartPortfolio or a custom plan that considers current low prices, but may blend in future purchases or new extended terms could be a great option given the latest energy market outlook.
Source: Wall Street Journal https://www.wsj.com/articles/electricity-prices-plummet-as-gas-wind-gain-traction-and-demand-stalls-1512043200