
Q&A: December Market Intel Webinar Insight – Part 2
5 min readDuring Constellation’s December Market Intel Webinar, principals from our Commodities Management Group spoke to topics such as an updated winter weather outlook, key winter price drivers to look out for, natural gas and power price reviews, long-term drivers for natural gas demand and more. If you were unable to attend, you can listen to the recording of the December webinar broadcast.
After the webinar, our attendees asked insightful questions that are pertinent to their unique business needs. To better provide answers and explanations to energy buyers like them, these questions and answers from our market professionals are below. This is a continuation of questions answered in our first webinar Q&A blog, please check it out if you haven’t done so already.
Q: Would you say CAISO SP15 prices are up because of the fires and/or dwindling nuclear generation?
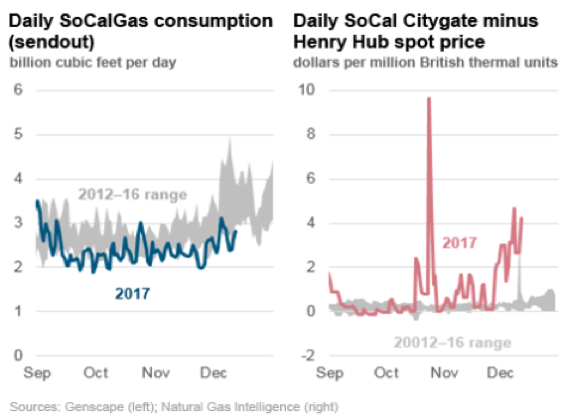
A: CAISO SP15 is operating on Real Time and, as a result, forward prices are up. This is due to a combination of three reasons 1) The recent forest fires 2) ongoing restricted storage capacity at Aliso Canyon and 3) pipeline outages. First, forest fires have forced some gas storage facilities to reduce withdrawal flows or postpone scheduled maintenance. On the power side, CAISO has needed to reduce some transmission line flows into the SoCal Edison system from both northern and eastern CA as well as AZ. This has resulted in gas fired generation in the LA basin being brought online. This increased demand for gas fired generation and lifted SoCal City gate prices. Second, a series of key outages in the SoCal gas system has lifted daily gas prices.
Source: EIA
Per EIA, some critical natural gas facility outages since October have been:
- October 1: A rupture on SoCalGas Line 235-2 in the Northern Zone has reduced deliveries to SoCalGas through the Northern Zone by 800 MMcf/d through December 25, with 450 MMcf/d remaining out of service indefinitely.
- November 16: An unplanned outage because of a natural gas quality issue reduced receipts from Transportadora de Gas Natural de Baja California (TGN) at Otay Mesa in the Southern Zone to zero through December 1.
- December 1: A force majeure on the Mojave Pipeline Company’s Mojave 2, has reduced capacity by 80 MMcf/d from December 1–31.
- December 5: Planned repairs on SoCalGas Line 2000 at Ehrenberg/Blythe in the Southern Zone reduced capacity by 200 MMcf/d from December 5–15 and will reduce capacity by 150 MMcf/d from December 18–20.
Finally, Aliso Canyon has been allowed to store 23.6 Bcf of storage vs. 86 Bcf of capacity. This is an improvement from last winter’s 15 Bcf. As the chart below illustrates, SoCal gas storage remains well below its 5-year range and if below normal temperatures were to be sustained from Dec-Feb, the likelihood of volatility increases on tighter supply. This has not occurred so far in December, but it remains a factor in forward prices for winter 2017-2018.
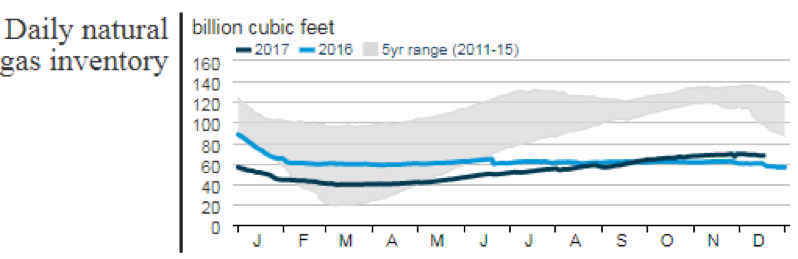
Source: EIA
These combined events have lifted SoCal Citygate spot and forward prices. Overall warm weather in November and December have helped limit volatility in prices by limiting furnace or electric heating demand.
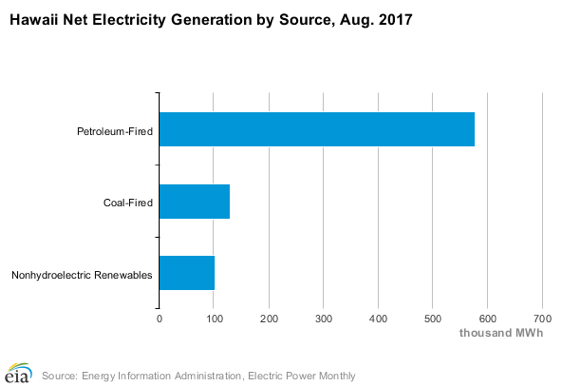
Q: Hawaii imports its natural gas in tankers. Which ports in the mainland US does that gas sail from? And how many tankers per week/month/year?
A: See EIA’s State Profile on Hawaii. Hawaii imports no liquefied natural gas, but instead has historically imported fuel oil and coal. There is a state law to replace with renewables by 2045.
QUICK FACTS
- In 2015, Hawaii imported 91% of the energy it consumed (mostly as petroleum).
- With its mild tropical climate, Hawaii had the fourth-lowest per capita energy use in the nation in 2015. The transportation sector accounted for more than half (51%) of Hawaii’s total energy demand in 2015, led by jet fuel use.
- In 2016, Hawaii generated more solar electricity per capita from distributed facilities than any other state, and solar energy from both utility-scale and distributed resources generated 38% of Hawaii’s net generation from renewable resources.
- Hawaii is one of seven states with utility-scale generation from geothermal energy. In 2016, 19% of Hawaii’s renewable net electricity generation came from geothermal energy.
- In 2016, Hawaii had the highest electricity prices in the nation. It is the first state to set a legal deadline for producing 100% of its electricity from renewable energy sources, a target it plans to achieve by 2045.
Source: EIA
Q: Is there a belief that there are massive shale plays in areas such as Russia, China and Africa? If so, what is the impact on the US ability to export if those areas are able to drill and provide natural gas more effectively than importing our liquefied natural gas?
A: The U.S. and Russia along with China are #1, #2 and #3 respectively when it comes to recoverable oil reserves, according to the EIA or Energy Information Administration. Currently Russia is banned from utilizing advanced drilling equipment and techniques for producing both oil and natural gas due to Ukraine-related sanctions. The Siberian Bazhenov formation is larger than both the Bakken and Eagle Ford formation in the U.S. combined. That reserve along with the Permian Basin in the U.S. could reshape the energy landscape for years to come once the Russians start tapping into their vast reserves.
It is difficult to comment on the impact that both Russia, China and even Africa would have on the global LNG market once they start producing significant amounts. However, from a very high level, the proximity and potential abundance of these commodities will surely bring much more supply to future demand in growth markets which can ultimately put downward pressure on future energy prices and cap some of the historical volatility that exists by widening the supply/demand balance considerably for years to come. Though these developments will create greater global supply in the long-term, the likelihood of these developments competing and having an impact in the near future are remote. It will take some time for both Russia and China to create the infrastructure necessary to start producing both oil and gas from these shales that will start competing with US supply on a competitive basis.
While the questions and answers featured help explain current market issues, they do not encompass the whole presentation. This webinar provides registrants with the latest topics that could affect our customers and their businesses to help them better manage their energy strategy like the recent winter cold snap experienced across the country. You can attend our January Market Intel Webinar for more market insight from our energy professionals, register today.
Get additional information about how to protect your business from market volatility caused by weather, rising oil prices and more by exploring our energy management solutions at constellation.com.